Venkat S. Malladi 0000-0002-0144-0564 · vsmalladi · katatonikkat The Laboratory of Signaling and Gene Regulation, Cecil H. and Ida Green Center for Reproductive Biology Sciences and Division of Basic Reproductive Biology Research, Department of Obstetrics and Gynecology, University of Texas Southwestern Medical Center; Department of Bioinformatics, University of Texas Southwestern Medical Center"
Anusha Nagari
The Laboratory of Signaling and Gene Regulation, Cecil H. and Ida Green Center for Reproductive Biology Sciences and Division of Basic Reproductive Biology Research, Department of Obstetrics and Gynecology, University of Texas Southwestern Medical Center
Hector L. Franco
The Laboratory of Signaling and Gene Regulation, Cecil H. and Ida Green Center for Reproductive Biology Sciences and Division of Basic Reproductive Biology Research, Department of Obstetrics and Gynecology, University of Texas Southwestern Medical Center; Department of Genetics and Lineberger Comprehensive Cancer Center, University of North Carolina at Chapel Hill"
W. Lee Kraus
The Laboratory of Signaling and Gene Regulation, Cecil H. and Ida Green Center for Reproductive Biology Sciences and Division of Basic Reproductive Biology Research, Department of Obstetrics and Gynecology, University of Texas Southwestern Medical Center
Abstract
The differentiation of embryonic stem cells into various lineages is highly dependent on the chromatin state and gene expression patterns. To identify the lineage specific enhancers driving the differentiation of pancreatic cells we used a previously described computational framework called Total Functional Score of Enhancer Elements (TFSEE), which integrates multiple genomic assays that probe both transcriptional and epigenetic states. Using TFSEE, we defined the enhancer landscape and identified TFs maintaining multipotency of endodermal stem cells during differentiation into pancreatic lineages. Thus, TFSEE can be used to perform multilayer genomic data integration to uncover novel cell type-specific TFs that control lineage-specific enhancers.
Introduction
Embryonic development is a complex process during which pluripotent cells differentiate into specialized cells of various lineages. The mechanisms operating the developmental competence are highly complex and are dependent on the responder tissue and precise timing of signaling cues[1]. Lineage specification is dependent on complex interaction of transcription factors and chromatin states at enhancers. Enhancers and the transcription factors (TFs) regulating their formation have been shown to play an important role in cell type-specific activation of gene expression [2,3]. Although thousands of potential enhancers have been identified in cell lineages and tissues, identification of the enhancers that are active versus inactive or poised remains a major challenge [4]. In addition, the ability to identify the TFs acting at the numerous enhancers in each cell type is technically challenging [5,6].
Enhancers have been shown to share several common features; such as increased chromatin accessibility (as measured by DNase-seq or ATAC-seq) [7,8,9] and enrichment of post-translational modification of histone tails (as assessed by ChIP-seq), including H3K4me1 and H3K27ac [10,11,12]. While these epigenetic features can successfully identify the location of many enhancers across the genome, they cannot readily differentiate between active and non-active enhancers [13,14]. Recent genomic assays have shown that enhancers tend to be bound by RNA polymerase II (Pol II) and transcribed, producing non-coding RNAs known as enhancer RNAs (‘eRNAs’) [15,16,17]. While the full breadth of of the enhancer RNA transcripts are unknown, we and others have shown that enhancer transcription (as measured by total RNA-seq, GRO-seq or PRO-seq) can be used in the absence of any other genomic information to as a predictor of enhancer activity [16,17,18,19,20,21,22,23,24,3].
In recent years, advances in technology have facilitated the large scale functional characterization of enhancer activity [25,26,27,28] and annotation of genome-wide binding sites of TFs in various cell types and tissues [29,5]. However, due to countless cell types, experimental conditions and the large number of TFs [30], integration of these independent data sets to achieve a comprehensive analysis of gene expression and actionable predictions of TFs driving cell type-specific gene expression can be very challenging. Furthermore, analyses that predict TF binding sites (TFBSs), which are usually 4-12 nucleotides in length [31], using TF binding profile databases [32,33,34], fail to consider that such sequences occur frequently by chance throughout the genome and that TF binding is cell type specific [35]. To overcome these limitations, we established a novel method called Total Functional Score of Enhancer Elements (TFSEE), which can be used to identify location and activity of enhancers in any cell or tissue type together with their cognate TFs.
In this study, we aimed to understand the TF driven transcriptional programs during the time course differentiation of human embryonic stem cells (hESC) towards pancreatic cell type [1]. This embryonic development model allowed us to explore the spatiotemporal gene regulation during development, by enhancers and TFs. In the studies presented herein, we provide a detailed characterization of TFSEE and demonstrate the broader use of TFSEE to identify enhancers and TFs during the differentiation of embryonic stem cells into pancreatic progenitor cells to uncover cell type-specific transcription factors that control lineage-specific enhancers.
Results
Unbiased Identification of Enhancers during Pancreatic Differentiation
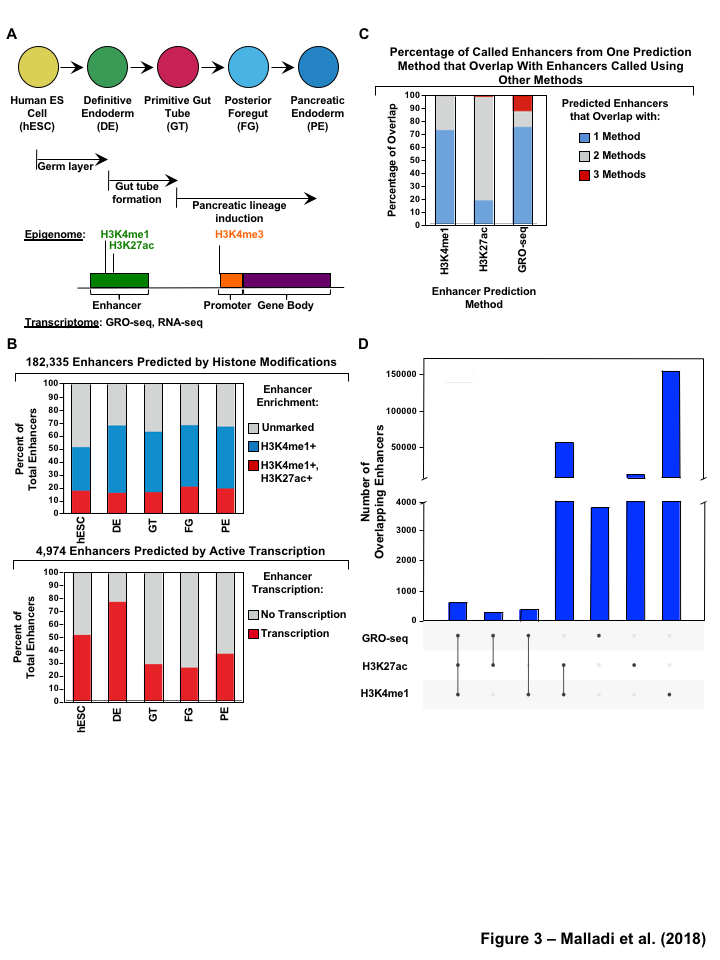
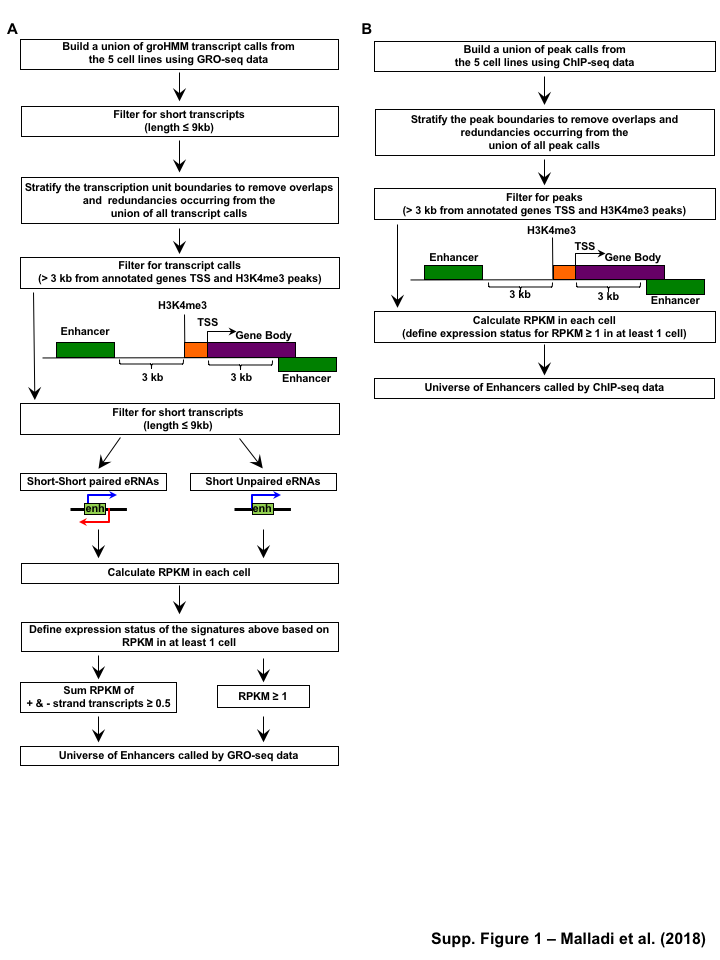
Enhancer identification methods using enrichment of histone modifications (e.g. H3K4me1 and H3K27ac) [10,11,12] or by enhancer transcription [17] are quite well established. For these analyses, we mined previously published ChIP-seq for 3 different histone modifications, in addition to GRO-seq and RNA-seq datasets at five defined stages of differentiation: hESCs, definitive endoderm (DE), primitive gut tube (GT), posterior foregut (FG), and pancreatic endoderm (PE) (Figure 1A, Table S1). We identified the enhancer universe for the cell lineages in pancreatic differentiation time course model by two methods:(1) enrichment of epigenomic marks (H3K4me1 or H3K27ac) (Figure S2B), (2) enhancer RNA (eRNA) signatures from GRO-seq (Figure S2A). In order to avoid the complications associated with enhancer transcription overlapping promoter transcription, we considered only the potential enhancers \(>\) 3 kb away from known transcription start sites (TSSs) of active protein-coding genes as identified by H3K4me3 [37] (Gencode version 19 annotations [38]) (Figure S3A).
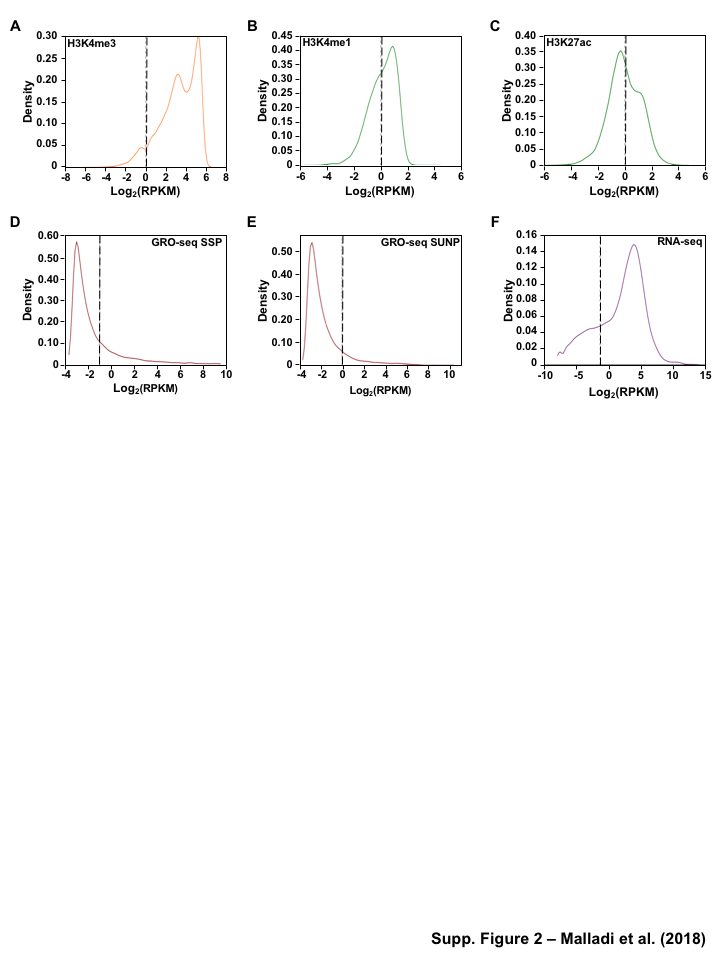
For the enhancers identified using the histone marks, by method 1, we further filtered the enhancer universe based on the enrichment of H3K4me1 and H3K27ac, (RPKM cutoff of \(\geq\) 1 (Figure S3B and C) for both marks in at least one cell line) and identified a set of 182,335 candidate enhancers across all stages of pancreatic differentiation (Figure 1B). The stringent filter is necessary to reduce false positive enhancers that could easily annotated as alternative chromatin states using ChromHMM [39], if more histone marks were available. We then identified a set of 4,974 candidate enhancers (Figure 1B) by method 2, using GRO-seq as described previously [20], using RPKM \(\geq\) 0.5 or \(\geq\) 1 (Figure S3D and E) in at least one cell lineage. We categorized these candidate enhancers for each cell line and found that \(\le\) 20% of the enhancers (histone modifications) and 25-75% (GRO-seq) were shared in each cell lineage. Additionally, the majority of histone called enhancers are marked by only H3K4me1 (Figure 1B). These results confirm the enhancer landscape across pancreatic differentiation reported by Wang et al.
Next we compared the enhancer universe called by histone prediction methods and enhancer transcription based approach. We compared the overlap from histone enhancer prediction methods (H3K4me1 or H3K27ac) to output from an enhancer transcription based approach (GRO-seq) and found that 12% of enhancers calls based on enhancer transcription using GRO-seq data are identified by all the of the other methods (enrichment of H3K4me1 and H3K27ac) (Figure 1C, S1A). Interestingly, greater than 75% of the enhancers were solely identified by enhancer transcription based approach were not called in the histone enhancer prediction method (H3K4me1 or H3K27ac) (Figure 1C and D, S1B). Although H3K27ac and H3K4me1 might be two histone modifications commonly associated with enhancers, these are not the only chromatin mark involved and other modifications may be present that were not assayed for [40]. In contrast, less than 1% of enhancers called based on enrichment of H3K4me1 or H3K27ac overlapped with the enhancers identified by the other methods (Figure 1C). This may in part, due to the fact that enhancer calling based on H3K4me1 or H3K27ac enrichment, yields much larger numbers of putative enhancers (Figure 1D), many of which may be false positives or inactive as the true regulatory elements (Figure S1C and D). Based on these findings, we decided to use the enhancers identified using GROseq (method2) which had the greater percent of enhancers that were called by all the three methods as an input to TFSEE model for the subsequent analysis.
The TFSEE model
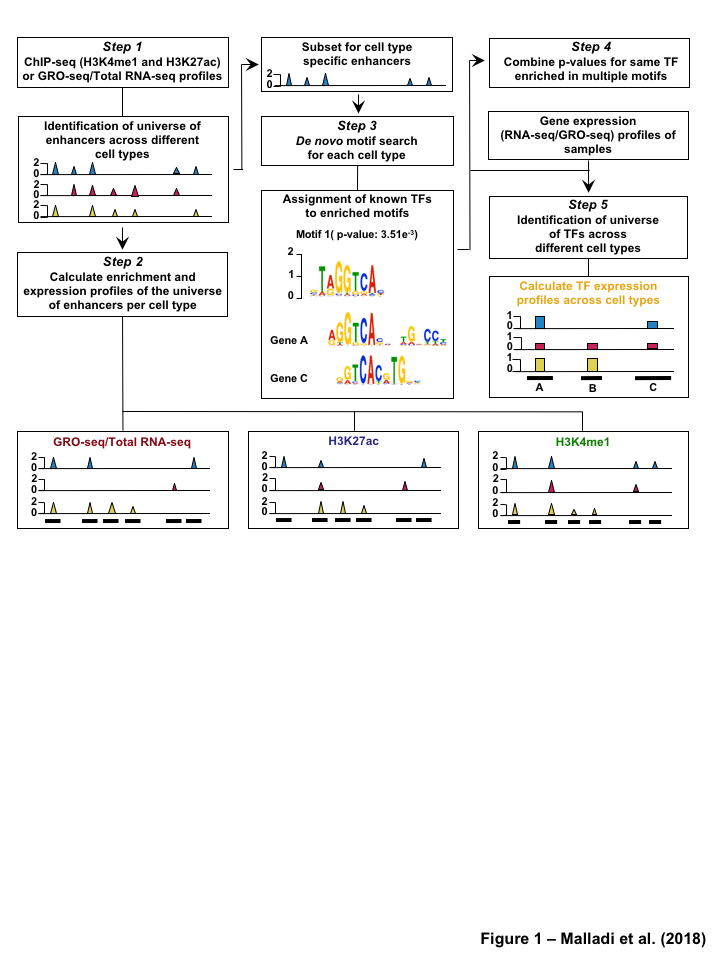
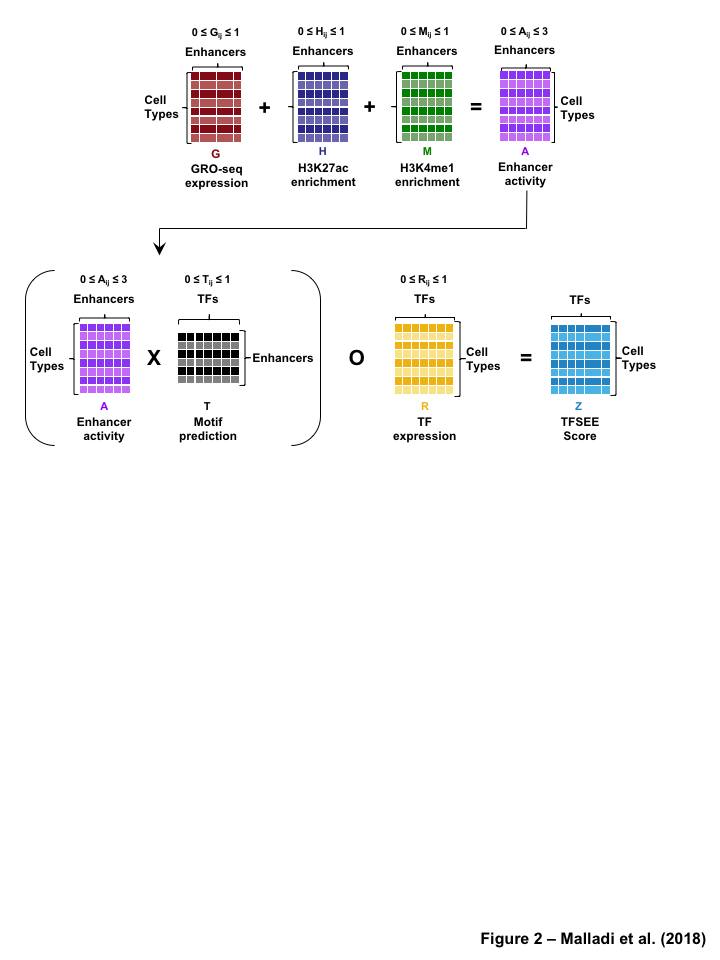
The TFSEE model integrates multiple genomics assays such as, GRO-seq, RNA-seq, and ChIP-seq, data with TF motif information to predict TFs driving the formation of active enhancers and the locations of their cognate enhancers. The TFSEE model consists of five key data processing steps (Figure 2) followed by a data integration stage (Figure 3). In step 1, a universe of active enhancers across the different constituent cell types are identified based on enhancer transcription (as in methods, n=4,974) GRO-seq or total RNA-seq (Figure S2A). One could also substitute this with the enhancers identified using the enrichment of epigenomic marks (as in methods, n=218,731) H3K4me1 and H3K27ac (Figure S2B). For these universe of enhancers per cell type, the genome-wide enhancer mark and activity levels were assessed by calculating histone mmark enrichment (H3K4me1 and H3K27ac) and eRNA transcription (GRO-seq or total RNA-seq) profiles, in step 2 of TFSEE. Next we generate an enhancer activity matrix ACxE for all cell types C for the universe active of E enhancers. We assume that the enhancer activity of each cell type is linearly correlated to the amount enhancer transcription (GRO-seq or total RNA-seq, G), and to the epigenomic marks (H3K4me1, M and H3K27ac, H). To reduce bias each individual enhancer enrichment is scaled between 0 and 1. Enhancer activity can be expressed as the following formula:
\(A = G + M + H\)
As TFSEE was mainly designed to detect enhancer activity changes and TF-enhancer links for each cell type, in steps 3-4 of TFSEE, the TF to enhancer links are determined by a de novo motif search and a matrix of probability of the TF is created annotating every enhancer to TF for each cell type. If a motif is represented multiple times for a given enhancer location, TFSEE combines the probability of that motif into a single p-value using Stouffer method. In step 5, the expression profile of all TF’s from step 4 was calculated from GRO-seq or RNA-seq data across all the cell types.
The final stage integrates all the data in steps 1-5 (Figure 3) to determine TFSEE score matrix and heatmap. First, the enhancer activity matrix ACxE, is combined with motif prediction matrix TExF, represent scaled motif prediction p-values, T, for each enhancer E, to form an intermediate matrix product. This matrix product is entrywise combined with TF expression matrix R, from step 5, the expression of each TF F for each cell type C, into a resulting matrix Z composed of C cell types and F TFs. TFSEE can be expressed as the following formula:
\(Z =( A \times T) \circ R\)
TFSEE identifies lineage-specific enhancers and their cognate TFs during pancreatic differentiation
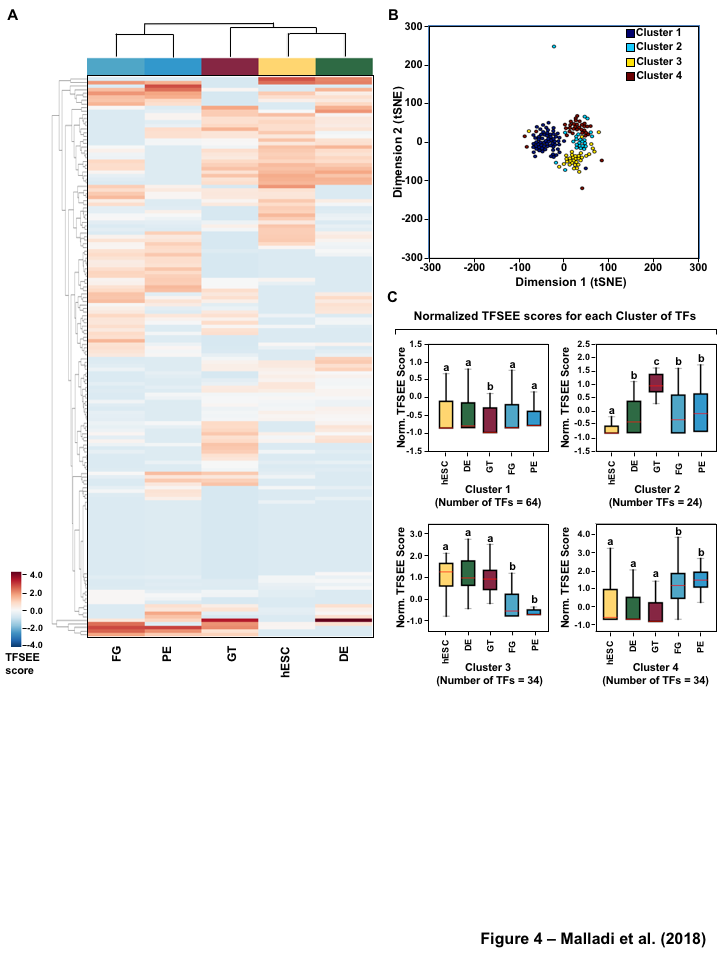
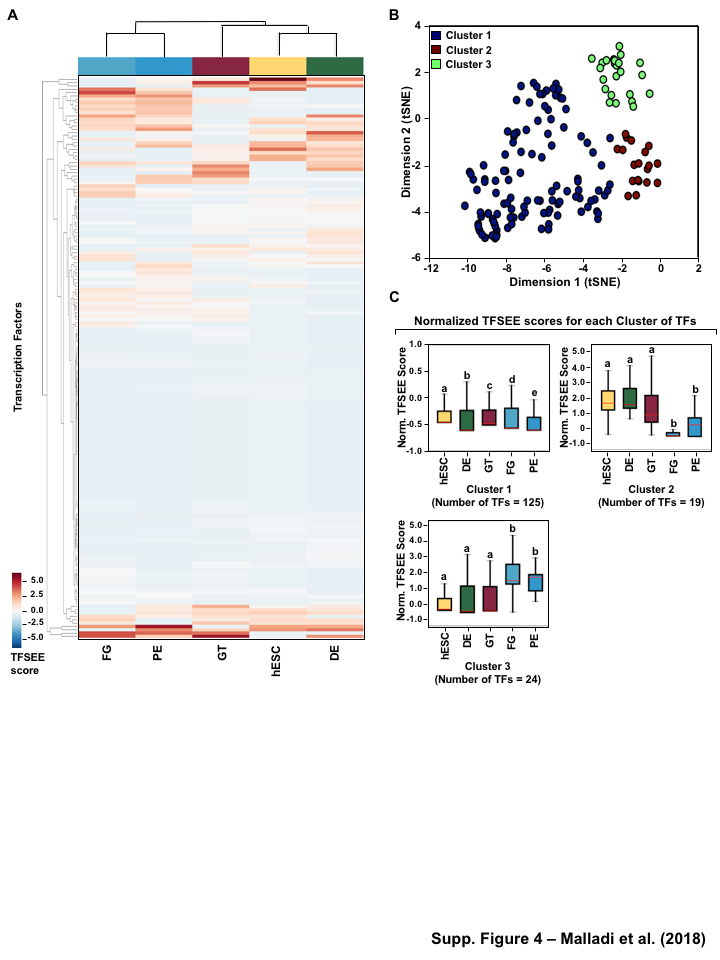
Having globally predicting the TFSEE scores across the lineages of pancreatic differentiation, we performed unsupervised hierarchical clustering on the enhancers predicted by GRO-seq method, which grouped the cell types into two major clades: (1) FG, and PE (2) hESC, DE, and GT (Figure 4A, S4A). To better understand the TF-enhancer dynamics across all differentiation stages we clustered the TFSEE score across all differentiation stages, revealing four major categories using enhancer transcription (Figure 4B). We examined the enrichment of putative enhancers and their associated TFs across stages by quantifying their normalized TFSEE score. This analysis revealed four major clusters: 1. driving early (hESC, DE) and late pancreatic differentiation (FG and PE), 2. enriched in GT, 3. driving pre-pancreatic linage (hESC, DE and GT), and 4. driving late-pancreatic differentiation (FG and PE) (Figure 4C). We also performed the unsupervised hierarchical clustering on the enhancers predicted by histone enrichment alone and retrieved only three clusters in contrast to the four clusters from enhancers predicted by GRO-seq method (Figure S4B). These results highlight TF-enhancers driving pre-pancreatic lineage (hESC, DE and GT), and late-pancreatic differentiation (FG and PE), but fails to highlight any other stage specific drivers (Figure S4C).
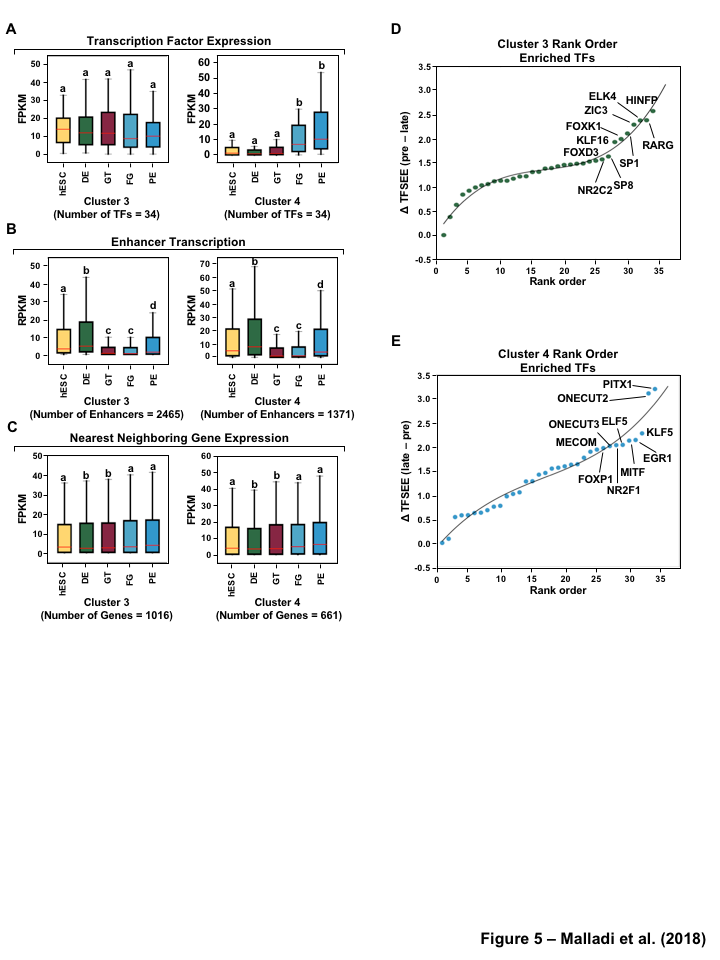
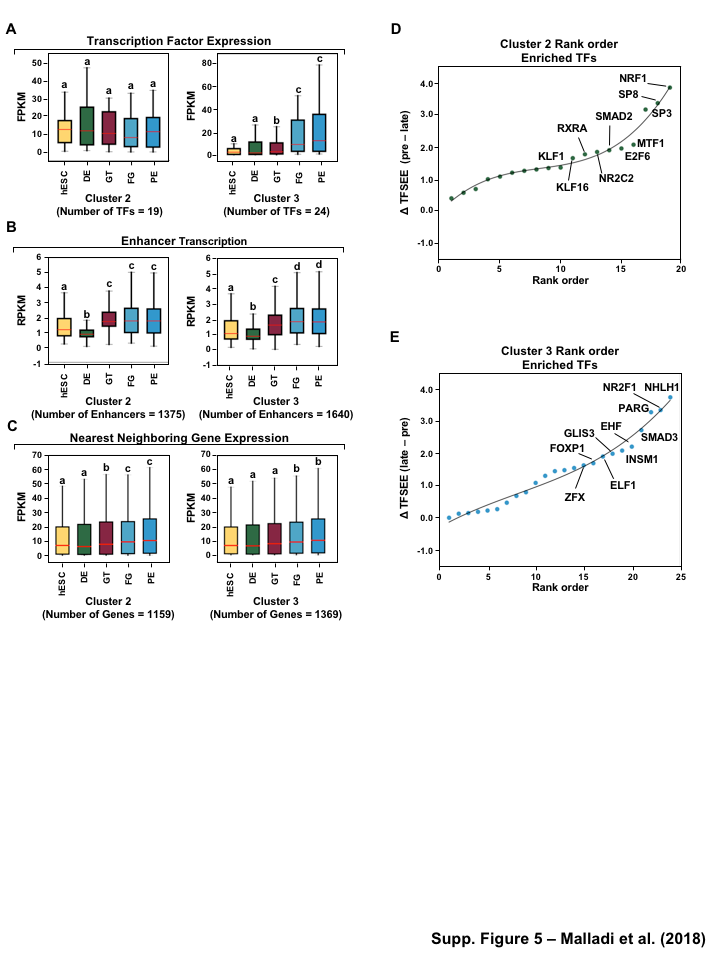
To investigate the the distinct roles of lineage specific enhancers and their cognate TFs that provide a clear demarcation of enrichment between pre- and late- pancreatic differentiation, we first examined the mRNA levels of the corresponding predicted TFs of each cluster in each of the stages. Our analysis revealed that TFs identified in pre-pancreatic lineage show equal expression across stages, while late-pancreatic TFs are highly expressed in FG and PE (Figure 5A, S5A) coinciding with pancreatic induction at the FG stage (Figure 1A). Conversely, we didn’t see an enrichment of TFs in a stage specific manner for either TFs enriched early (hESC, DE) and late pancreatic differentiation (FG and PE) or those maintaining GT pluripotency (Figure S6A).
Next, we determined if enhancer transcription corresponding to the enriched TFs in each cluster, using TFSEE score, correlates with the regulation of their nearby genes. To do so, we identified the enhancers corresponding to the predicted TFs using enriched binding motif prediction, and then determined the level of transcription for each enhancer, using GRO-seq or H3K27ac ChIP-seq, (Figure 5B, S5B, S6B) and the nearest neighboring gene (upstream or downstream), using RNA-seq (Figure 5C, S5C, S6C). Interestingly, transcribed enhancers exhibited stage specific enrichment, which doesn’t correspond to the patterns found from TFSEE enrichment (Figure 5B, S5B, S6B). This result reflects that 1364 of the enhancers, 55% (n=2465, cluster 3) and 99% (n=1371, cluster 4), are shared between clusters and the variation between clusters is due to differences in TF expression and affinity to motifs. Likewise, the nearest neighboring gene for each transcribed enhancer doesn’t exhibit stage specific enrichment (Figure 5C, S5C, S6C) due to the vast abundance of enhancers and thus neighboring genes shared between the clusters. However, without further high-throughput data to study promoter-enhancer linking (as measured by 4C, ChIA-PET, or Hi-C) [41] it is difficult to understand the stage specific regulatory network.
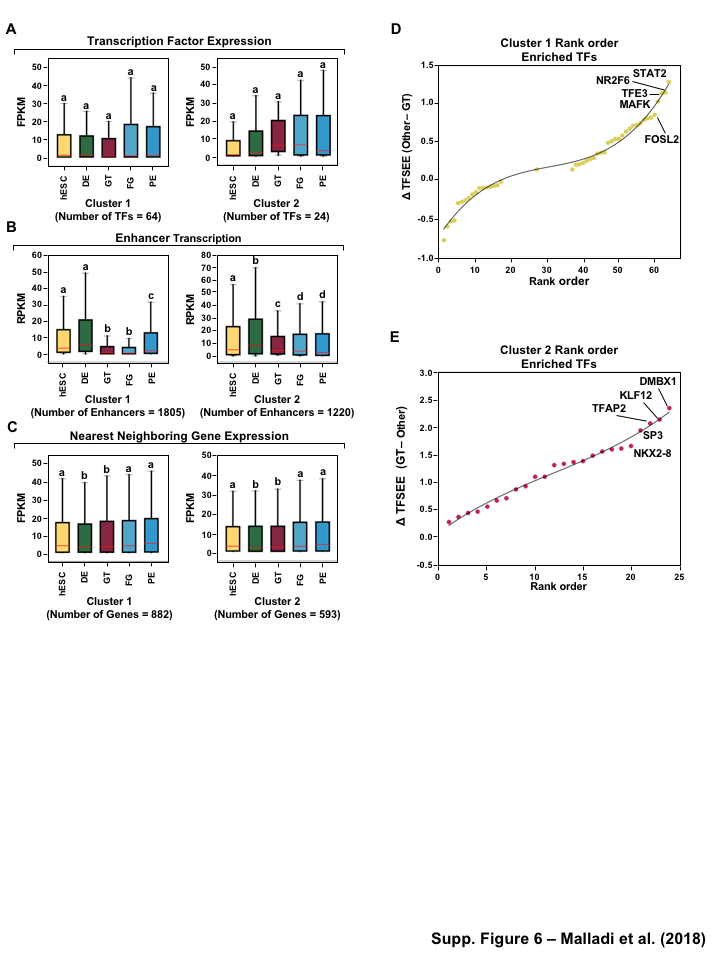
To further understand the potential regulators of each cluster we determined a rank order frequency distribution for all TFs within each cluster (Figure 5D and E). This analysis revealed enrichment of HINFP, RARG, ZIC3, and SP1-like family TFs (SP1 and SP8) which are important regulators of embryonic development [44] (Figure 5D). Additionally, the Onecut family (ONECUT2 and ONECUT3), EGR1, MITF and FOXP1 TFs are enriched in cluster 4 and have been shown to function in pancreatic and islet cell development [48] (Figure 5E). Similar results were obtained for comparison of TFSEE scores from different clusters using GRO-seq and Histone called enhancers (Figure S6D and E, S5D and E).
To compare TFs enriched between GRO-seq and Histone driven TFSEE scores we compared the TFs enriched in pre- and late-pancreatic differentiation. We found 9 and 12 TFs enriched in common for pre- and late-pancreatic respectively. The differences in TFs that are enriched may be due, in part, to enhancer calling using H3K4me1 and H3K27ac enrichment, yields much larger numbers of putative enhancers, many of which may be false positives or inactive as true regulatory elements producing more varied enriched TF motifs. Altogether, our results show that TFSEE can be used to identify cell type-specific transcription factors that control lineage-specific enhancers
Discussion
The intricate mechanisms involved in driving the lineage specific transcriptional responses during development remain poorly understood. In this study, we integrated a variety of publicly available high throughput sequencing data from pancreatic lineage development to identify the potential regulators driving the early or late pancreatic lineage development. Our analysis showed the enrichment of the Onecut family (ONECUT2 and ONECUT3), EGR1, MITF and FOXP1 TFs in the late pancreatic differentiation phase (FG, PE) and have been shown to function in pancreatic and islet cell development [48]. In this process, we also provide a detailed operational description of TFSEE, a previously published computational method [52] for identification of active enhancers and associated cognate TFs during the time course differentiation of human embryonic stem cells (hESC) towards pancreatic cell type. TFSEE employs multi-view clustering of multiple genomic assays that directly models changes in the transcriptional and epigenetic states across cell-types. This approach allowed us to directly integrate disparate data while encoding assumptions and dependencies between data types in an interpretable and extendable model. TFSEE model gains power by both explicitly modeling the enhancer landscape for each cell type and detecting the enhancer activity changes and TF:enhancer links across all cell types. So far, we applied TFSEE on transcriptional and epigenomic data from time course differentiation of human embryonic stem cells [1,36] and a variety of breast cancer cell lines [52]. Our results show that this method can identify cell type-specific TFs and their linked enhancers that are biologically relevant which needs further biological validation. In particular, this method identifies TFs bound at active enhancers which regulate gene expression patterns, supporting the biological relevance of TFSEE predictions. In this study, we showed enrichment of HINFP, RARG, ZIC3, and SP1-like family TFs (SP1 and SP8) using TFSEE which are known important regulators of embryonic development [44,45,46,47]. Additionally, the model enables novel analysis of driver TFs with limited amount of data. The model was able to identify lineage specific TFs with as little five cell types and with only three data types (Figure 4B, S4B). A limitation of the TFSEE method is that while the model can be used with reduced data types for enhancer identification it fails to highlight additional subtype specific drivers (Figure 4C, S4C) and of the overlapping clusters identified only a subset of TFs are jointly enriched (Figure S5F and G. However, additional ATAC-seq [53], ChIP-seq or DNase-seq data could easily be added to TFSEE and extend the model providing greater granularity on subtype specific TF clusters, however these extended analyses were not included in this study.
Conclusions
The increasing availability of different genomic data sets provides an opportunity to perform data integration to uncover novel cell type-specific transcription factor (TF) drivers. To facilitate identification of these drivers we developed TFSEE, which systemically identify active enhancers and associated cognate TFs. We showed that TFSEE can identify stage specific TFs during differentiation of endodermal stem cells into pancreatic lineages. Collectively, our results show how TFSEE can be used to predict molecular drivers maintaining cell type-specific function and biology.
Acknowledgments
Material and Methods
Genomic Data Curation
We used previously published GRO-seq, ChIP-seq and RNA-seq data from [1,36] time course differentiation of human embryonic stem cells (hESC) to pancreatic endoderm (PE). All data sets are available from NCBI’s Gene Expression Omnibus [54] or EMBL-EBI’s ArrayExpress [55] repositories using the accession numbers listed in Table S1.
Table S1:Description and accession numbers of GRO-seq, ChIP-seq and RNA-seq datasets. Summary of assay and accession of raw data for time course differentiation of human embryonic stem cells (hESC) to pancreatic endoderm (PE) used in this study. All data sets are available from NCBI’s Gene Expression Omnibus or EMBL-EBI’s ArrayExpress.
The raw reads were aligned to the human reference genome (GRCh37/hg19) using default parameters in Bowtie version 1.0.0 [56]. The aligned reads were subsequently filtered for quality and uniquely mappable reads were retained for further analysis using Samtools version 0.1.19 [57] and Picard version 1.127 [58]. Library complexity was measured using BEDTools version 2.17.0 [59] and meets ENCODE data quality standards [60]. Relaxed peaks were called using MACS version 2.1.0 [61] with a p-value of \(1 \times 10^{-2}\) for each replicate, pooled replicates’ reads and pseudoreplicates. Peak calls from the pooled replicates that are either observed in both replicates, or in both pseudoreplicates were used for subsequent analysis.
Analysis of RNA-seq Data Sets
The raw reads were aligned to the human reference genome (GRCh37/hg19) using default parameters in STAR version 2.4.2a [62]. Quantification of genes against Gencode version 19 [38] annotations was done using default parameters in RSEM version 1.2.31 [63].
Analysis of GRO-seq Data
The GRO-seq reads were trimmed to the first 36 bases to trim adapter and low quality sequence, using default parameters of fastx_trimer in fastx-toolkit version 0.0.13.2 [64]. The trimmed reads were aligned to the human reference genome (GRCh37/hg19) using default parameters in BWA version 0.7.12 [65].
Kernel Density
Kernel density plot representations were used to express the univariate distribution of ChIP-seq reads under peaks, RNA-seq reads for protein-coding genes and GRO-seq reads for short paired and short unpaired eRNAs. The kernel density plots were calculated in Python (ver. 2.7.11) using the kdeplot function from seaborn version 0.7.1 [66] with default parameters.
Defining Transcription Start Sites and Promoters
We made distinct transcription start sites (TSS) for protein-coding genes from Gencode version 19 [38] annotations using MakeGencodeTSS [67]. We identified active promoters, as identified by H3K4me3 [37]. A RPKM cutoff of \(\geq\) 1 for H3K4me3 in at least one cell line was used to identify a peak as an active enhancer (Figure S3A).
Enhancer calling by ChIP-seq
Calling Active Enhancers.
We built a universe of peak calls by merging the peaks from individual cell lines for histone modifications (H3K4me1 and H3K27ac) and stratifying the boundaries to remove overlaps/redundancies occurring from the union of all peaks. Potential enhancers were defined as peaks that were \(>\) 3kb from known TSS, protein coding genes from Gencode version 19 annotations [38], and H3K4me3 peaks. A RPKM cutoff of \(\geq\) 1 for H3K4me1 and H3K27ac (Figure S3B and C) in at least one cell line was used to identify a peak as an active enhancer. The universe of active enhancers was assembled using the cutoffs noted above for each cell line and was used for further analyses.
Motif Analyses.
De novo motif analyses were performed on a 1 kb region (\(\pm\) 500 bp) surrounding the peak summit for the top 10000 enhancers, using the command-line version of MEME-ChIP from MEME Suite version 4.11.1 [68,69]. The following parameters were used for motif prediction: (1) zero or one occurrence per sequence (-mod zoops); (2) number of motifs (-nmotifs 15); (3) minimum, maximum width of the motif (-minw 8, -maxw 15). All the other parameters were set at the default. The predicted motifs from MEME were matched to known motifs in the JASPAR database (JASPAR_CORE_2016_vertebrates.meme) [33] using TOMTOM [34].
Enhancer calling by GRO-seq
Transcript calling.
Transcript calling was performed using a two-state hidden Markov model using the groHMM data analysis package version 3.4 [17,22,70] on each individual cell lines. The negative log transition probability of the switch between transcribed state to non-transcribed state and the variance in read counts in the non-transcribed state that are used to predict the transcription units for the cell lines in this study are listed Table S2.
Table S2:groHMM tunning parameters. Table summarizing the shape setting parameters and -log transition probabilities used to predict the transcription units for each cell lines using GRO-seq data with groHMM method.
Cell Line
-Log Transition Probability
Variance in read counts
hES
50
45
DE
50
35
GT
50
50
FG
50
35
PE
50
35
We then built a universe of transcripts by merging the groHMM-called transcripts from individual cell lines and stratifying the boundaries to remove overlaps/redundancies occurring from the union of all transcripts.
Calling Enhancer Transcripts.
We filtered and collected a subset of short intergenic transcripts \(<\) 9 kb in length and \(>\) 3 kb away from known transcription start sites (TSSs) of protein-coding genes from Gencode version 19 annotations [38], and H3K4me3 peaks. These were further classified into (1) short paired eRNAs and (2) short unpaired eRNAs as described previously [20]. For the short paired eRNAs, the sum of the GRO-seq RPKM values for both strands of DNA was used to determine if an enhancer transcript pair is expressed using a cutoff of RPKM \(\geq\) 0.5 (Figure S3D). An RPKM cutoff of \(\geq\) 1 was used to determine the universe expressed short unpaired eRNAs (Figure S3E). The comprehensive of expressed eRNAs (short paired and short unpaired) was assembled using the cutoffs noted above for each cell line was used for further analyses.
Motif Analyses.
De novo motif analyses was performed on a 1 kb region (\(\pm\) 500 bp) surrounding the overlap center or the transcription start site for short paired and short unpaired eRNAs, respectively, using the command-line version of MEME from MEME Suite version 4.11.1 [68]. The following parameters were used for motif prediction: (1) zero or one occurrence per sequence (-mod zoops); (2) number of motifs (-nmotifs 15); (3) minimum, maximum width of the motif (-minw 8, -maxw 15); and (4) search for motif in given strand and reverse complement strand (-revcomp). The predicted motifs from MEME were matched to known motifs in the JASPAR database (JASPAR_CORE_2016_vertebrates.meme) [33] using TOMTOM [34].
Generating Heatmaps and Clusters
For each cell line, the functional scores were Z-score normalized. To identify cognate transcription factors by cell type, we performed hierarchical clustering by calculating the Euclidean distance using clustermap from seaborn version 0.7.1 [66]. For visualization of the multidimensional TFSEE scores, we performed t-distributed stochastic neighbor embedding analysis (t-SNE) [71] using the TSNE function and labeled the clusters by calculating K-means clustering using the KMeans function with the expectation-maximization algorithm in scikit-learn version 0.17.1 [72,73,74].
Nearest Neighboring Gene Analyses and Box Plots
The universe of expressed genes in each cell line was determined from the RNA-seq data using a FPKM cutoff of \(>\) 0.4 (Figure S3F). The set of nearest neighboring expressed genes for each enhancer defined by an expressed eRNA or the enrichment of active histone marks was determined for each cell line. Box plot representations were used to express the levels of transcription or enrichment for each called enhancer and transcription of their nearest neighboring expressed genes. The read distribution (RPKM) for each enhancer or (FPKM) gene was calculated and plotted using the boxplot function from matplotlib version 2.0.2 [75,76]. Wilcoxon rank sum tests were performed to determine the statistical significance of all comparisons.
Figures and Figure Legends
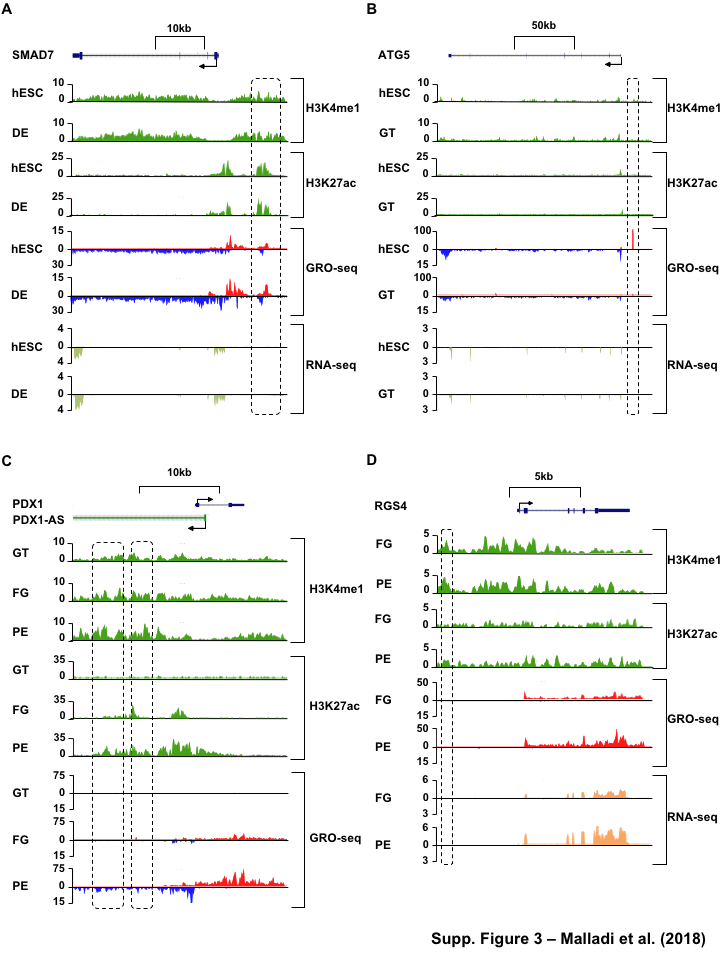
Figure 1:Comparison of genome-wide prediction of enhancers during pancreatic differentiation.(A)(Top) Schematic of pancreatic differentiation starting from Human embryonic stem cells (hESCs) to pancreatic endoderm (PE). (Bottom) Depiction of epigenomic (ChIP-seq) and transcriptional (GRO-seq and RNA-seq) profiles for each cell line used for analysis. (B) Stacked bar chart comparing expression of candidate enhancers categorized by (Top) H3K4me1 and H3K27ac enrichment, or (Bottom) enhancer transcription (GRO-seq). (C) Stacked bar chart comparing enhancer prediction methods in pancreatic differentiation. Enhancers were called using enhancer transcription (GRO-seq) or by using H3K4me1 enrichment, or H3K27ac enrichment. The percentage of called enhancers from one prediction method that overlap with enhancers called using other methods is shown. (D) UpSet plot showing the set intersection of enhancer identification methods shown in panel C.Figure 2:Data Processing for Total Functional Score of Enhancer Elements (TFSEE) Method. The TFSEE method has five data processing steps that are used to identify enhancer location and activity and their cognate transcription factors (TFs). In step 1, epigenomic (ChIP-seq) or the transcriptional (GRO-seq or total RNA-seq) profiles are used to generate a universe of active enhancers across the different constituent cell types. In step 2, TFSEE calculates the enrichment (H3K4me1 and H3K27ac) and eRNA transcription (GRO-seq and total RNA-seq) profiles under all identified active enhancers per cell type. Cell type-specific enhancers are used as input for step 3, where a de novo motif search is performed to identify potential TFs at each enhancer. If a motif is represented multiple times for a given enhancer location, TFSEE combines the probability of that motif into a single p-value in step 4. Step 5 integrates the amount of eRNA transcription (GRO-seq or total RNA-seq) and the expression of the TFs whose motifs were predicted in step 3 and 4 for all cell types, to provide an output of TF expression profiles across every cell type.Figure 3:Overview of Total Functional Score of Enhancer Elements (TFSEE) Method. TFSEE combines diverse data sets to identify enhancer location and activity and their cognate transcription factors (TFs). An illustration of TFSEE data integration stage, taking the outputs generated in panel A, to identify the location, activity level, and predicted TFs at each enhancer across all cell types. (Top) All matrices represent scaled enhancer activity for each cell type in each enhancer prediction method (G, H, and M). All matrices are linearly combined into a resulting matrix A, to provide a total enhancer activity score. (Bottom) Enhancer activity matrix A, is combined with motif prediction matrix T, represent scaled motif prediction p-values for each enhancer, to form an intermediate matrix product. This matrix product is entrywise combined with TF expression matrix R (scaled TF expression for each cell type), into a resulting matrix Z, on which TFSEE clustering is performed.Figure 4:TFSEE identifies cell type-specific enhancers and their cognate TFs that drive gene expression during pancreatic differentiation.(A) Unsupervised hierarchical clustering of cell type-normalized TFSEE scores shown in a heatmap representation. hESC (human embryonic stem cell); DE (definitive endoderm); GT (primitive gut tube); FG (posterior foregut); PE (pancreatic endoderm). (B) Biaxial t-SNE clustering plot of cell type-normalized TFSEE scores showing evidence of four distinct clusters, each point represents an individual TF. (C) Box plots of normalized TFSEE score for clusters identified in pancreatic differentiation (panel B), number of TFs are indicated in each cluster. Bars marked with different letters are significantly different (Wilcoxon rank sum test, \(p \lt 1 \times 10^{-4}\)). Cluster 1, TFs associated with early (hESC, DE) and late pancreatic differentiation (FG and PE). Cluster 2, TFs associated with GT pluripotency. Cluster 3, TFs associated with pre-pancreatic lineage induction (hESC, DE and GT). Cluster 4, TFs associated with late-pancreatic differentiation (FG and PE).Figure 5:TFSEE-Predicted TFs are enriched in pre- and late- pancreatic differentiation.(A-C) Box plots of normalized TF expression (panel A), enhancer transcription (panel B), and gene expression for the nearest neighboring genes to active enhancers (panel C) in pre- (cluster 3) and late-pancreatic (cluster 4) differentiation across the different cell types. Bars marked with different letters are significantly different from each other (Wilcoxon rank sum test). hESC (human embryonic stem cell); DE (definitive endoderm); GT (primitive gut tube); FG (posterior foregut); PE (pancreatic endoderm). (A) TFs identified in cluster 3 by TFSEE show equal expression across differentiation. While, cluster 4 highlights TFs highly expressed in FG and PE. TF expression as measured by RNA-seq. Number of TFs in each cluster are in parenthesis. (\(p \lt 1 \times 10^{-4}\)) (B) Enhancer transcription as measured by GRO-seq. Number of enhancers in each cluster are in parenthesis. \(p \lt 1 \times 10^{-4}\)). (C) Gene expression as measured by RNA-seq. Number of genes in each cluster are in parenthesis. (\(p \lt 0.05\)) (D and E) Rank order of TFs enriched in the Cluster 3 and the Cluster 4 identified using TFSEE. The top ten TFs in each Cluster are noted.Figure S1:Enhancer transcription is a better predictor of enhancer activity and target gene expression than other features of active chromatin.(A-D) UCSC Genome browser views of GRO-seq, histone modification ChIP-seq and RNA-seq data showing a transcribed enhancer (black box with dashed line) and its nearest neighboring gene. hESC (human embryonic stem cell); DE (definitive endoderm); GT (primitive gut tube); FG (posterior foregut); PE (pancreatic endoderm). (A) Browser view showing a transcribed enhancer and its nearest neighboring gene (SMAD7). The data highlights histone modifications typically enriched at enhancers (green), however the increased transcription determined by GRO-seq (red/blue) for DE correlates to expression of nearest genes determined by RNA-seq (orange/light green). (B) Browser view showing a transcribed enhancer and its nearest neighboring gene (ATG5. The data highlights an enhancer identified by GRO-seq (red/blue), however lacks typical histone modifications enriched at enhancers (green). The increased transcription determined by GRO-seq for hESC correlates to expression of nearest genes determined by RNA-seq (orange/light green). (C) Browser view showing a transcribed enhancer and its nearest neighboring gene (PDX1). The data highlights an enhancer identified by histone modifications enriched at enhancers (green), however increased transcription determined by GRO-seq (red/blue) correlates with antisense gene (AS-PDX1). (D) Browser view showing a transcribed enhancer and its nearest neighboring gene (RGS4). The data highlights an enhancer identified by histone modifications enriched at enhancers (green), however lacks enhancer transcription identified by GRO-seq (red/blue). The increased enhancer signal determined by histone modifications for PE shows correlates to expression of nearest genes determined by RNA-seq (orange/light green) and GRO-seq (red/blue).Figure S2:Unbiased, genome-wide prediction of active enhancers.(A) Overview of the computational pipeline used for the genome-wide annotation of enhancer transcripts (eRNAs) and prediction of active enhancers using GRO-seq data. (B) Overview of the computational pipeline used for the genome-wide annotation of and prediction of active enhancers using ChIP-seq (H3K4me1 and H3K27ac) data.Figure S3:Density plots of enhancer and gene expression levels across all cell types. Kernel density plots of log-transformed RPKM and FPKM values for determining active enhancers and genes. The dashed grey line represents the minimum expression cutoff. (A) Density plot of H3K4me3 (promoter mark) cutoff RPKM \(\geq 1\). (B) Density plot of H3K4me1 (enhancer mark) cutoff RPKM \(\geq 1\). (C) Density plot of H3K27ac (enhancer mark) cutoff RPKM \(\geq 1\). (D) Density plot of short-short paired GRO-seq transcription (SSP) (enhancer mark) cutoff RPKM \(\geq 1\). (E) Density plot of short-unpaired GRO-seq transcription (SUNP) ( enhancer mark) cutoff RPKM \(\geq 0.5\). (F) Density plot of RNA-seq (gene expression) cutoff FPKM \(\geq 0.4\)Figure S4:TFSEE defined by histone modifications identifies cell type-specific enhancers and their cognate TFs that drive gene expression in pancreatic differentiation.(A) Unsupervised hierarchical clustering of cell line normalized TFSEE scores shown in a heatmap representation. (B) Biaxial t-SNE clustering plot of cell type-normalized TFSEE scores showing evidence of three distinct clusters, each point represents an individual TF. (C) Boxplots of normalized TFSEE score for clusters identified in pancreatic differentiation. Bars marked with different letters are significantly different from each other (Wilcoxon rank sum test, \(p \lt 1 \times 10^{-2}\)). Number of TFs in each cluster are in parenthesis. Cluster 1, TFs associated across pancreatic lineage Cluster 2, TFs associated with pre-pancreatic lineage induction (hESC, DE and GT). Cluster 3, TFs associated with late-pancreatic differentiation (FG and PE).Figure S5:TFSEE-Predicted TFs, by histone modifications, are enriched in pre- and late- pancreatic differentiation.(A-C) Box plots of normalized TF expression (panel A), enhancer transcription (panel B), and gene expression for the nearest neighboring genes to active enhancers (panel C) in pre- (cluster 2) and late-pancreatic (cluster 3) differentiation across the different cell types. Bars marked with different letters are significantly different from each other (Wilcoxon rank sum test). hESC (human embryonic stem cell); DE (definitive endoderm); GT (primitive gut tube); FG (posterior foregut); PE (pancreatic endoderm). (A) TFs identified in cluster 2 by TFSEE show equal expression across differentiation. While, cluster 3 highlights TFs highly expressed in FG and PE. TF expression as measured by RNA-seq. Number of TFs in each cluster are in parenthesis. (\(p \lt 1 \times 10^{-4}\)) (B) Enhancer transcription as measured by ChIP-seq (H3K27ac enrichment). Number of enhancers in each cluster are in parenthesis. (\(p \lt 1 \times 10^{-4}\)). (C) Gene expression as measured by RNA-seq. Number of genes in each cluster are in parenthesis. (\(p \lt 0.05\)). (D and E) Rank order of TFs enriched in the Cluster 2 and the Cluster 3 identified using TFSEE. The top ten TFs in each Cluster are noted.Figure S6:TFSEE-Predicted TFs are enriched and depleted in Primitive Gut Tube during pancreatic differentiation.(A-C) Box plots of normalized TF expression (panel A), enhancer transcription (panel B), and gene expression for the nearest neighboring genes to active enhancers (panel C) in depleted (cluster 1) and enriched (cluster 2) in primitive gut tube during pancreatic differentiation across different cell types. Bars marked with different letters are significantly different from each other (Wilcoxon rank sum test). hESC (human embryonic stem cell); DE (definitive endoderm); GT (primitive gut tube); FG (posterior foregut); PE (pancreatic endoderm). (A) TF expression as measured by RNA-seq. Number of TFs in each cluster are in parenthesis. (\(p \lt 1 \times 10^{-2}\)) (B) Enhancer transcription as measured by GRO-seq. Number of enhancers in each cluster are in parenthesis. (\(p \lt 1 \times 10^{-4}\)). (C) Gene expression as measured by RNA-seq. Number of genes in each cluster are in parenthesis. (\(p \lt 0.05\)). (D and E) Rank order of TFs enriched in the Cluster 1 and the Cluster 2 identified using TFSEE. The top five TFs in each Cluster are noted.
References
1. Epigenetic Priming of Enhancers Predicts Developmental Competence of hESC-Derived Endodermal Lineage Intermediates
Allen Wang, Feng Yue, Yan Li, Ruiyu Xie, Thomas Harper, Nisha A. Patel, Kayla Muth, Jeffrey Palmer, Yunjiang Qiu, Jinzhao Wang, … Maike Sander Cell Stem Cell (2015-04) https://doi.org/10.1016/j.stem.2015.02.013
2. Transcriptional enhancers: from properties to genome-wide predictions
Daria Shlyueva, Gerald Stampfel, Alexander Stark Nature Reviews Genetics (2014-03-11) https://doi.org/10.1038/nrg3682
3. The selection and function of cell type-specific enhancers
Sven Heinz, Casey E. Romanoski, Christopher Benner, Christopher K. Glass Nature Reviews Molecular Cell Biology (2015-02-04) https://doi.org/10.1038/nrm3949
4. Progress and challenges in bioinformatics approaches for enhancer identification
Dimitrios Kleftogiannis, Panos Kalnis, Vladimir B. Bajic Briefings in Bioinformatics (2015-12-03) https://doi.org/10.1093/bib/bbv101
7. Genome-wide mapping of DNase hypersensitive sites using massively parallel signature sequencing (MPSS)
G. E. Crawford Genome Research (2005-12-12) https://doi.org/10.1101/gr.4074106
8. Patterns of regulatory activity across diverse human cell types predict tissue identity, transcription factor binding, and long-range interactions
N. C. Sheffield, R. E. Thurman, L. Song, A. Safi, J. A. Stamatoyannopoulos, B. Lenhard, G. E. Crawford, T. S. Furey Genome Research (2013-03-12) https://doi.org/10.1101/gr.152140.112
9. Discovery of Transcription Factors and Regulatory Regions Driving In Vivo Tumor Development by ATAC-seq and FAIRE-seq Open Chromatin Profiling
Kristofer Davie, Jelle Jacobs, Mardelle Atkins, Delphine Potier, Valerie Christiaens, Georg Halder, Stein Aerts PLOS Genetics (2015-02-13) https://doi.org/10.1371/journal.pgen.1004994
10. Distinct and predictive chromatin signatures of transcriptional promoters and enhancers in the human genome
Nathaniel D Heintzman, Rhona K Stuart, Gary Hon, Yutao Fu, Christina W Ching, R David Hawkins, Leah O Barrera, Sara Van Calcar, Chunxu Qu, Keith A Ching, … Bing Ren Nature Genetics (2007-02-04) https://doi.org/10.1038/ng1966
11. Histone modifications at human enhancers reflect global cell-type-specific gene expression
Nathaniel D. Heintzman, Gary C. Hon, R. David Hawkins, Pouya Kheradpour, Alexander Stark, Lindsey F. Harp, Zhen Ye, Leonard K. Lee, Rhona K. Stuart, Christina W. Ching, … Bing Ren Nature (2009-03-18) https://doi.org/10.1038/nature07829
12. Distinct and Predictive Histone Lysine Acetylation Patterns at Promoters, Enhancers, and Gene Bodies
Nisha Rajagopal, Jason Ernst, Pradipta Ray, Jie Wu, Michael Zhang, Manolis Kellis, Bing Ren G3: Genes|Genomes|Genetics (2014-08-12) https://doi.org/10.1534/g3.114.013565
13. Effects on the transcriptome upon deletion of a distal element cannot be predicted by the size of the H3K27Ac peak in human cells
Yu Gyoung Tak, Yuli Hung, Lijing Yao, Matthew R. Grimmer, Albert Do, Mital S. Bhakta, Henriette O’Geen, David J. Segal, Peggy J. Farnham Nucleic Acids Research (2016-01-06) https://doi.org/10.1093/nar/gkv1530
14. Occupancy by key transcription factors is a more accurate predictor of enhancer activity than histone modifications or chromatin accessibility
Nergiz Dogan, Weisheng Wu, Christapher S Morrissey, Kuan-Bei Chen, Aaron Stonestrom, Maria Long, Cheryl A Keller, Yong Cheng, Deepti Jain, Axel Visel, … Ross C Hardison Epigenetics & Chromatin (2015-04-23) https://doi.org/10.1186/s13072-015-0009-5
15. A Large Fraction of Extragenic RNA Pol II Transcription Sites Overlap Enhancers
Francesca De Santa, Iros Barozzi, Flore Mietton, Serena Ghisletti, Sara Polletti, Betsabeh Khoramian Tusi, Heiko Muller, Jiannis Ragoussis, Chia-Lin Wei, Gioacchino Natoli PLoS Biology (2010-05-11) https://doi.org/10.1371/journal.pbio.1000384
16. Architectural and Functional Commonalities between Enhancers and Promoters
Tae-Kyung Kim, Ramin Shiekhattar Cell (2015-08) https://doi.org/10.1016/j.cell.2015.08.008
17. A Rapid, Extensive, and Transient Transcriptional Response to Estrogen Signaling in Breast Cancer Cells
Nasun Hah, Charles G. Danko, Leighton Core, Joshua J. Waterfall, Adam Siepel, John T. Lis, W. Lee Kraus Cell (2011-05) https://doi.org/10.1016/j.cell.2011.03.042
18. Tissue-Specific RNA Expression Marks Distant-Acting Developmental Enhancers
Han Wu, Alex S. Nord, Jennifer A. Akiyama, Malak Shoukry, Veena Afzal, Edward M. Rubin, Len A. Pennacchio, Axel Visel PLoS Genetics (2014-09-04) https://doi.org/10.1371/journal.pgen.1004610
19. Reprogramming transcription by distinct classes of enhancers functionally defined by eRNA
Dong Wang, Ivan Garcia-Bassets, Chris Benner, Wenbo Li, Xue Su, Yiming Zhou, Jinsong Qiu, Wen Liu, Minna U. Kaikkonen, Kenneth A. Ohgi, … Xiang-Dong Fu Nature (2011-05-15) https://doi.org/10.1038/nature10006
20. Enhancer transcripts mark active estrogen receptor binding sites
N. Hah, S. Murakami, A. Nagari, C. G. Danko, W. L. Kraus Genome Research (2013-05-01) https://doi.org/10.1101/gr.152306.112
21. Analysis of nascent RNA identifies a unified architecture of initiation regions at mammalian promoters and enhancers
Leighton J Core, André L Martins, Charles G Danko, Colin T Waters, Adam Siepel, John T Lis Nature Genetics (2014-11-10) https://doi.org/10.1038/ng.3142
22. groHMM: a computational tool for identifying unannotated and cell type-specific transcription units from global run-on sequencing data
Minho Chae, Charles G. Danko, W. Lee Kraus BMC Bioinformatics (2015-07-16) https://doi.org/10.1186/s12859-015-0656-3
23. Functional roles of enhancer RNAs for oestrogen-dependent transcriptional activation
Wenbo Li, Dimple Notani, Qi Ma, Bogdan Tanasa, Esperanza Nunez, Aaron Yun Chen, Daria Merkurjev, Jie Zhang, Kenneth Ohgi, Xiaoyuan Song, … Michael G. Rosenfeld Nature (2013-06) https://doi.org/10.1038/nature12210
24. TNFα Signaling Exposes Latent Estrogen Receptor Binding Sites to Alter the Breast Cancer Cell Transcriptome
Hector L. Franco, Anusha Nagari, W. Lee Kraus Molecular Cell (2015-04) https://doi.org/10.1016/j.molcel.2015.02.001
25. VISTA Enhancer Browser–a database of tissue-specific human enhancers
A. Visel, S. Minovitsky, I. Dubchak, L. A. Pennacchio Nucleic Acids Research (2007-01-03) https://doi.org/10.1093/nar/gkl822
26. Systematic dissection of regulatory motifs in 2000 predicted human enhancers using a massively parallel reporter assay
P. Kheradpour, J. Ernst, A. Melnikov, P. Rogov, L. Wang, X. Zhang, J. Alston, T. S. Mikkelsen, M. Kellis Genome Research (2013-03-19) https://doi.org/10.1101/gr.144899.112
27. Genome-Wide Quantitative Enhancer Activity Maps Identified by STARR-seq
C. D. Arnold, D. Gerlach, C. Stelzer, L. M. Boryn, M. Rath, A. Stark Science (2013-01-17) https://doi.org/10.1126/science.1232542
28. High-throughput functional testing of ENCODE segmentation predictions
Jamie C. Kwasnieski, Christopher Fiore, Hemangi G. Chaudhari, Barak A. Cohen Genome Research (2014-07-17) https://doi.org/10.1101/gr.173518.114
29. Architecture of the human regulatory network derived from ENCODE data
Mark B. Gerstein, Anshul Kundaje, Manoj Hariharan, Stephen G. Landt, Koon-Kiu Yan, Chao Cheng, Xinmeng Jasmine Mu, Ekta Khurana, Joel Rozowsky, Roger Alexander, … Michael Snyder Nature (2012-09) https://doi.org/10.1038/nature11245
30. A census of human transcription factors: function, expression and evolution
Juan M. Vaquerizas, Sarah K. Kummerfeld, Sarah A. Teichmann, Nicholas M. Luscombe Nature Reviews Genetics (2009-04) https://doi.org/10.1038/nrg2538
31. DNA-dependent formation of transcription factor pairs alters their binding specificity
Arttu Jolma, Yimeng Yin, Kazuhiro R. Nitta, Kashyap Dave, Alexander Popov, Minna Taipale, Martin Enge, Teemu Kivioja, Ekaterina Morgunova, Jussi Taipale Nature (2015-11) https://doi.org/10.1038/nature15518
32. DNA-Binding Specificities of Human Transcription Factors
Arttu Jolma, Jian Yan, Thomas Whitington, Jarkko Toivonen, Kazuhiro R. Nitta, Pasi Rastas, Ekaterina Morgunova, Martin Enge, Mikko Taipale, Gonghong Wei, … Jussi Taipale Cell (2013-01) https://doi.org/10.1016/j.cell.2012.12.009
33. JASPAR 2016: a major expansion and update of the open-access database of transcription factor binding profiles
Anthony Mathelier, Oriol Fornes, David J. Arenillas, Chih-yu Chen, Grégoire Denay, Jessica Lee, Wenqiang Shi, Casper Shyr, Ge Tan, Rebecca Worsley-Hunt, … Wyeth W. Wasserman Nucleic Acids Research (2015-11-03) https://doi.org/10.1093/nar/gkv1176
34. Quantifying similarity between motifs
Shobhit Gupta, John A Stamatoyannopoulos, Timothy L Bailey, William Noble Genome Biology (2007) https://doi.org/10.1186/gb-2007-8-2-r24
35. Functional analysis of transcription factor binding sites in human promoters
Troy W Whitfield, Jie Wang, Patrick J Collins, E Christopher Partridge, Shelley Aldred, Nathan D Trinklein, Richard M Myers, Zhiping Weng Genome Biology (2012) https://doi.org/10.1186/gb-2012-13-9-r50
36. Dynamic Chromatin Remodeling Mediated by Polycomb Proteins Orchestrates Pancreatic Differentiation of Human Embryonic Stem Cells
Ruiyu Xie, Logan J. Everett, Hee-Woong Lim, Nisha A. Patel, Jonathan Schug, Evert Kroon, Olivia G. Kelly, Allen Wang, Kevin A. D’Amour, Allan J. Robins, … Maike Sander Cell Stem Cell (2013-02) https://doi.org/10.1016/j.stem.2012.11.023
37. A Chromatin Landmark and Transcription Initiation at Most Promoters in Human Cells
Matthew G. Guenther, Stuart S. Levine, Laurie A. Boyer, Rudolf Jaenisch, Richard A. Young Cell (2007-07) https://doi.org/10.1016/j.cell.2007.05.042
38. GENCODE: The reference human genome annotation for The ENCODE Project
J. Harrow, A. Frankish, J. M. Gonzalez, E. Tapanari, M. Diekhans, F. Kokocinski, B. L. Aken, D. Barrell, A. Zadissa, S. Searle, … T. J. Hubbard Genome Research (2012-09-01) https://doi.org/10.1101/gr.135350.111
39. Chromatin-state discovery and genome annotation with ChromHMM
Jason Ernst, Manolis Kellis Nature Protocols (2017-11-09) https://doi.org/10.1038/nprot.2017.124
40. Predicting enhancer transcription and activity from chromatin modifications
Yun Zhu, Lin Sun, Zhao Chen, John W. Whitaker, Tao Wang, Wei Wang Nucleic Acids Research (2013-09-12) https://doi.org/10.1093/nar/gkt826
41. Nuclear organization of active and inactive chromatin domains uncovered by chromosome conformation capture–on-chip (4C)
Marieke Simonis, Petra Klous, Erik Splinter, Yuri Moshkin, Rob Willemsen, Elzo de Wit, Bas van Steensel, Wouter de Laat Nature Genetics (2006-10-08) https://doi.org/10.1038/ng1896
42. ChIA-PET analysis of transcriptional chromatin interactions
Jingyao Zhang, Huay Mei Poh, Su Qin Peh, Yee Yen Sia, Guoliang Li, Fabianus Hendriyan Mulawadi, Yufen Goh, Melissa J. Fullwood, Wing-Kin Sung, Xiaoan Ruan, Yijun Ruan Methods (2012-11) https://doi.org/10.1016/j.ymeth.2012.08.009
43. Mapping long-range promoter contacts in human cells with high-resolution capture Hi-C
Borbala Mifsud, Filipe Tavares-Cadete, Alice N Young, Robert Sugar, Stefan Schoenfelder, Lauren Ferreira, Steven W Wingett, Simon Andrews, William Grey, Philip A Ewels, … Cameron S Osborne Nature Genetics (2015-05-04) https://doi.org/10.1038/ng.3286
44. The histone gene activator HINFP is a nonredundant cyclin E/CDK2 effector during early embryonic cell cycles
R. Xie, R. Medina, Y. Zhang, S. Hussain, J. Colby, P. Ghule, S. Sundararajan, M. Keeler, L.-J. Liu, M. van der Deen, … G. S. Stein Proceedings of the National Academy of Sciences (2009-07-09) https://doi.org/10.1073/pnas.0905651106
45. Nuclear receptor regulation of stemness and stem cell differentiation
Yangsik Jeong, David J. Mangelsdorf Experimental and Molecular Medicine (2009) https://doi.org/10.3858/emm.2009.41.8.091
46. Zic3 Is Required for Maintenance of Pluripotency in Embryonic Stem Cells
Linda Shushan Lim, Yuin-Han Loh, Weiwei Zhang, Yixun Li, Xi Chen, Yinan Wang, Manjiri Bakre, Huck-Hui Ng, Lawrence W. Stanton Molecular Biology of the Cell (2007-04) https://doi.org/10.1091/mbc.e06-07-0624
47. Sp1-like transcription factors are regulators of embryonic development in vertebrates
Chengtian Zhao, Anming Meng Development, Growth and Differentiation (2005-05) https://doi.org/10.1111/j.1440-169x.2005.00797.x
48. Role of the Onecut transcription factors in pancreas morphogenesis and in pancreatic and enteric endocrine differentiation
Vinciane Vanhorenbeeck, Marjorie Jenny, Jean-François Cornut, Gérard Gradwohl, Frédéric P. Lemaigre, Guy G. Rousseau, Patrick Jacquemin Developmental Biology (2007-05) https://doi.org/10.1016/j.ydbio.2007.02.027
49. Critical Role of Egr Transcription Factors in Regulating Insulin Biosynthesis, Blood Glucose Homeostasis, and Islet Size
Isabelle Müller, Oliver G. Rössler, Christine Wittig, Michael D. Menger, Gerald Thiel Endocrinology (2012-07) https://doi.org/10.1210/en.2012-1064
50. Microphthalmia Transcription Factor Regulates Pancreatic β-Cell Function
Magdalena A. Mazur, Marcus Winkler, Elvira Ganić, Jesper K. Colberg, Jenny K. Johansson, Hedvig Bennet, Malin Fex, Ulrike A. Nuber, Isabella Artner Diabetes (2013-04-22) https://doi.org/10.2337/db12-1464
51. The FOXP1, FOXP2 and FOXP4 transcription factors are required for islet alpha cell proliferation and function in mice
Jason M. Spaeth, Chad S. Hunter, Lauren Bonatakis, Min Guo, Catherine A. French, Ian Slack, Manami Hara, Simon E. Fisher, Jorge Ferrer, Edward E. Morrisey, … Roland Stein Diabetologia (2015-05-29) https://doi.org/10.1007/s00125-015-3635-3
52. Enhancer transcription reveals subtype-specific gene expression programs controlling breast cancer pathogenesis
Hector L. Franco, Anusha Nagari, Venkat S. Malladi, Wenqian Li, Yuanxin Xi, Dana Richardson, Kendra L. Allton, Kaori Tanaka, Jing Li, Shino Murakami, … W. Lee Kraus Genome Research (2017-12-22) https://doi.org/10.1101/gr.226019.117
53. FOXA2 Is Required for Enhancer Priming during Pancreatic Differentiation
Kihyun Lee, Hyunwoo Cho, Robert W. Rickert, Qing V. Li, Julian Pulecio, Christina S. Leslie, Danwei Huangfu Cell Reports (2019-07) https://doi.org/10.1016/j.celrep.2019.06.034
56. Ultrafast and memory-efficient alignment of short DNA sequences to the human genome
Ben Langmead, Cole Trapnell, Mihai Pop, Steven L Salzberg Genome Biology (2009) https://doi.org/10.1186/gb-2009-10-3-r25
57. The Sequence Alignment/Map format and SAMtools
H. Li, B. Handsaker, A. Wysoker, T. Fennell, J. Ruan, N. Homer, G. Marth, G. Abecasis, R. Durbin, Bioinformatics (2009-06-08) https://doi.org/10.1093/bioinformatics/btp352
60. ChIP-seq guidelines and practices of the ENCODE and modENCODE consortia
S. G. Landt, G. K. Marinov, A. Kundaje, P. Kheradpour, F. Pauli, S. Batzoglou, B. E. Bernstein, P. Bickel, J. B. Brown, P. Cayting, … M. Snyder Genome Research (2012-09-01) https://doi.org/10.1101/gr.136184.111
61. Identifying ChIP-seq enrichment using MACS
Jianxing Feng, Tao Liu, Bo Qin, Yong Zhang, Xiaole Shirley Liu Nature Protocols (2012-08-30) https://doi.org/10.1038/nprot.2012.101
62. STAR: ultrafast universal RNA-seq aligner
Alexander Dobin, Carrie A. Davis, Felix Schlesinger, Jorg Drenkow, Chris Zaleski, Sonali Jha, Philippe Batut, Mark Chaisson, Thomas R. Gingeras Bioinformatics (2012-10-25) https://doi.org/10.1093/bioinformatics/bts635
63. RSEM: accurate transcript quantification from RNA-Seq data with or without a reference genome
Bo Li, Colin N Dewey BMC Bioinformatics (2011-08-04) https://doi.org/10.1186/1471-2105-12-323
66. Seaborn: V0.7.1 (June 2016)
Michael Waskom, Olga Botvinnik, Drewokane, Paul Hobson,, David, Yaroslav Halchenko, Saulius Lukauskas, John B. Cole, Jordi Warmenhoven, Julian De Ruiter, … Antony Lee Zenodo (2016-06-05) https://doi.org/10.5281/zenodo.54844
68. MEME SUITE: tools for motif discovery and searching
T. L. Bailey, M. Boden, F. A. Buske, M. Frith, C. E. Grant, L. Clementi, J. Ren, W. W. Li, W. S. Noble Nucleic Acids Research (2009-05-20) https://doi.org/10.1093/nar/gkp335
71. Visualizing data using t-SNE
Laurens van der Maaten, Geoffrey Hinton Journal of Machine Learning Research 9 (2008-11)
72. Scikit-learn: Machine Learning in Python
Fabian Pedregosa, Gaël Varoquaux, Alexandre Gramfort, Vincent Michel, Bertrand Thirion, Olivier Grisel, Mathieu Blondel, Andreas Müller, Joel Nothman, Gilles Louppe, … Édouard Duchesnay arXiv (2012-01-02) https://arxiv.org/abs/1201.0490v4
73. Visualizing Large-scale and High-dimensional Data
Jian Tang, Jingzhou Liu, Ming Zhang, Qiaozhu Mei Proceedings of the 25th International Conference on World Wide Web - WWW ’16 (2016) https://doi.org/10.1145/2872427.2883041
74. Scikit-Learn: 0.17.1 Release Tag For Doi
Olivier Grisel, Andreas Mueller, Fabian Pedregosa,, Lars, Alexandre Gramfort, Gilles Louppe, Peter Prettenhofer, Mathieu Blondel, Vlad Niculae, Arnaud Joly, … Maheshakya Wijewardena Zenodo (2016-04-17) https://doi.org/10.5281/zenodo.49911
76. Matplotlib/Matplotlib V2.0.2
Michael Droettboom, Thomas A Caswell, John Hunter, Eric Firing, Jens Hedegaard Nielsen, Nelle Varoquaux, Benjamin Root, Phil Elson, Darren Dale, Jae-Joon Lee, … Nikita Kniazev Zenodo (2017-05-10) https://doi.org/10.5281/zenodo.573577